Analysis

Load Cleaned Version

library(tidyverse)
── Attaching core tidyverse packages ──────────────────────── tidyverse 2.0.0 ──
✔ dplyr     1.1.4     ✔ readr     2.1.5
✔ forcats   1.0.0     ✔ stringr   1.5.1
✔ ggplot2   3.5.2     ✔ tibble    3.3.0
✔ lubridate 1.9.4     ✔ tidyr     1.3.1
✔ purrr     1.1.0     
── Conflicts ────────────────────────────────────────── tidyverse_conflicts() ──
✖ dplyr::filter() masks stats::filter()
✖ dplyr::lag()    masks stats::lag()
ℹ Use the conflicted package (<http://conflicted.r-lib.org/>) to force all conflicts to become errors
library(ggplot2)
load("data_clean.RData")
glimpse(df_clean)
Rows: 100,000
Columns: 7
$ ACountry       <chr> "Afghanistan", "Afghanistan", "Albania", "Albania", "Al…
$ OCountry       <chr> "Iran (Islamic Rep. of)", "Pakistan", "Afghanistan", "C…
$ year           <int> 2024, 2024, 2024, 2024, 2024, 2024, 2024, 2024, 2024, 2…
$ refugees       <dbl> 39, 20827, 5, 14, 9, 45, 13, 34, 37, 6, 5, 16, 85, 95, …
$ UNassisted     <dbl> 39, 20827, 5, 14, 9, 45, 13, 34, 23, 6, 5, 16, 85, 95, …
$ total_refugees <dbl> 39, 20827, 5, 14, 9, 45, 13, 34, 9250, 6, 5, 16, 85, 95…
$ total_assisted <dbl> 39, 20827, 5, 14, 9, 45, 13, 34, 46, 6, 5, 16, 85, 95, …
Q1:

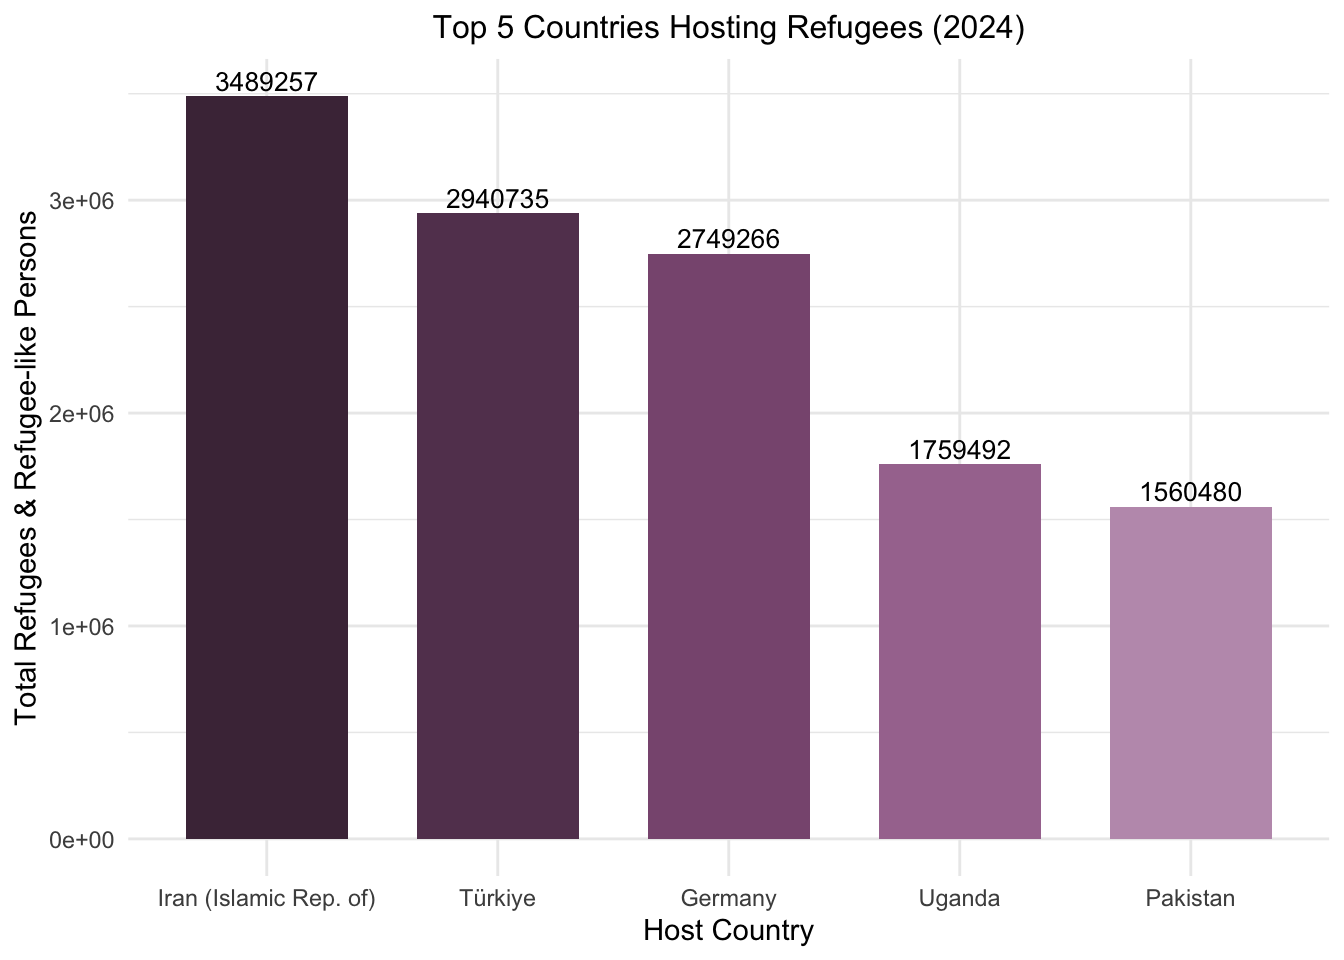
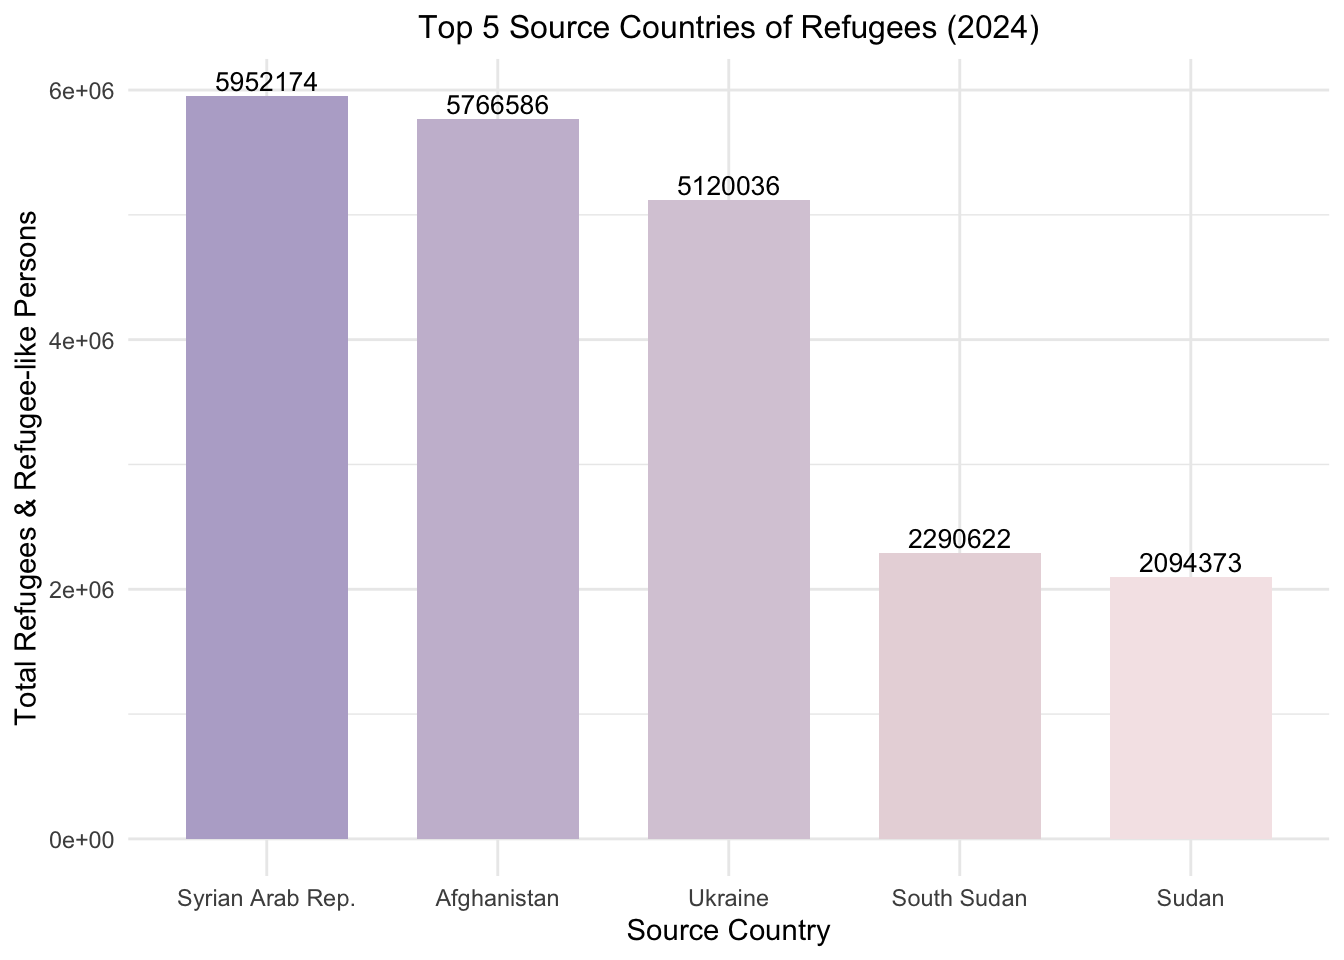
Which are the top five countries in the world that hosted the largest number of “refugees and people in refugee-like situations” in 2024? And which five countries are the main sources of these refugees?

# step 1: Top 5 countries that accept the most Refugees
top5_host <- df_clean |>
  filter(year == 2024) |> # filter data for only 2024 data retained
  group_by(ACountry) |> # divided into multiple subsets by country
  summarise(total_hosted = sum(total_refugees, na.rm = TRUE)) |>
  arrange(-total_hosted) |> 
  head(n = 5) # choose the top 5 countries

print(top5_host)
# A tibble: 5 × 2
  ACountry               total_hosted
  <chr>                         <dbl>
1 Iran (Islamic Rep. of)      3489257
2 Türkiye                     2940735
3 Germany                     2749266
4 Uganda                      1759492
5 Pakistan                    1560480
# step 2: Top 5 source countries of refugees
top5_origin <- df_clean |>
  filter(year == 2024) |> # filter data for only 2024 data retained
  group_by(OCountry) |> # divided into multiple subsets by country
  summarise(total_origin = sum(total_refugees, na.rm = TRUE)) |>
  arrange(-total_origin) |> 
  head(n = 5) # choose the top 5 countries

print(top5_origin)
# A tibble: 5 × 2
  OCountry         total_origin
  <chr>                   <dbl>
1 Syrian Arab Rep.      5952174
2 Afghanistan           5766586
3 Ukraine               5120036
4 South Sudan           2290622
5 Sudan                 2094373
# step 3: visualize Top 5 countries accept the most Refugees
ggplot(top5_host, aes(x = fct_reorder(ACountry, -total_hosted), # sort in descending order
                      y = total_hosted, 
                      fill = ACountry)) +
  geom_col(width = 0.7) + # set the column width to 0.7
  geom_text(aes(label = total_hosted), # Add text labels to the columns
    vjust = -0.3,
    size = 3.5) +
  labs(
    title = "Top 5 Countries Hosting Refugees (2024)",
    x = "Host Country",
    y = "Total Refugees & Refugee-like Persons") +
  scale_fill_manual(
    values = c("Iran (Islamic Rep. of)" = "#4B3046",
               "Türkiye" = "#64405D",
               "Germany" = "#89587F",
               "Uganda" = "#A7769E",
               "Pakistan" = "#BF9BB9")) + # Specify the fill color for each column
  theme_minimal() +
  theme(legend.position = "none", # no need legend
        plot.title = element_text(hjust = 0.5, size = 12))

# step 4: visualize Top 5 source countries of refugees
ggplot(top5_origin, aes(x = fct_reorder(OCountry, -total_origin), # sort in descending order
                      y = total_origin, 
                      fill = OCountry)) +
  geom_col(width = 0.7) +
  geom_text(aes(label = total_origin), # Add text labels to the columns
    vjust = -0.3,
    size = 3.5) +
  labs(
    title = "Top 5 Source Countries of Refugees (2024)",
    x = "Source Country",
    y = "Total Refugees & Refugee-like Persons") +
  scale_fill_manual(
    values = c("Syrian Arab Rep." = "#B8AECF",
               "Afghanistan" = "#C9BDD4",
               "Ukraine" = "#D8CBD9",
               "South Sudan" = "#E8D8DC",
               "Sudan" = "#F5E6E8")) + # Specify the fill color for each column
  theme_minimal() +
  theme(legend.position = "none", # no need legend
        plot.title = element_text(hjust = 0.5, size = 12))

Q2:

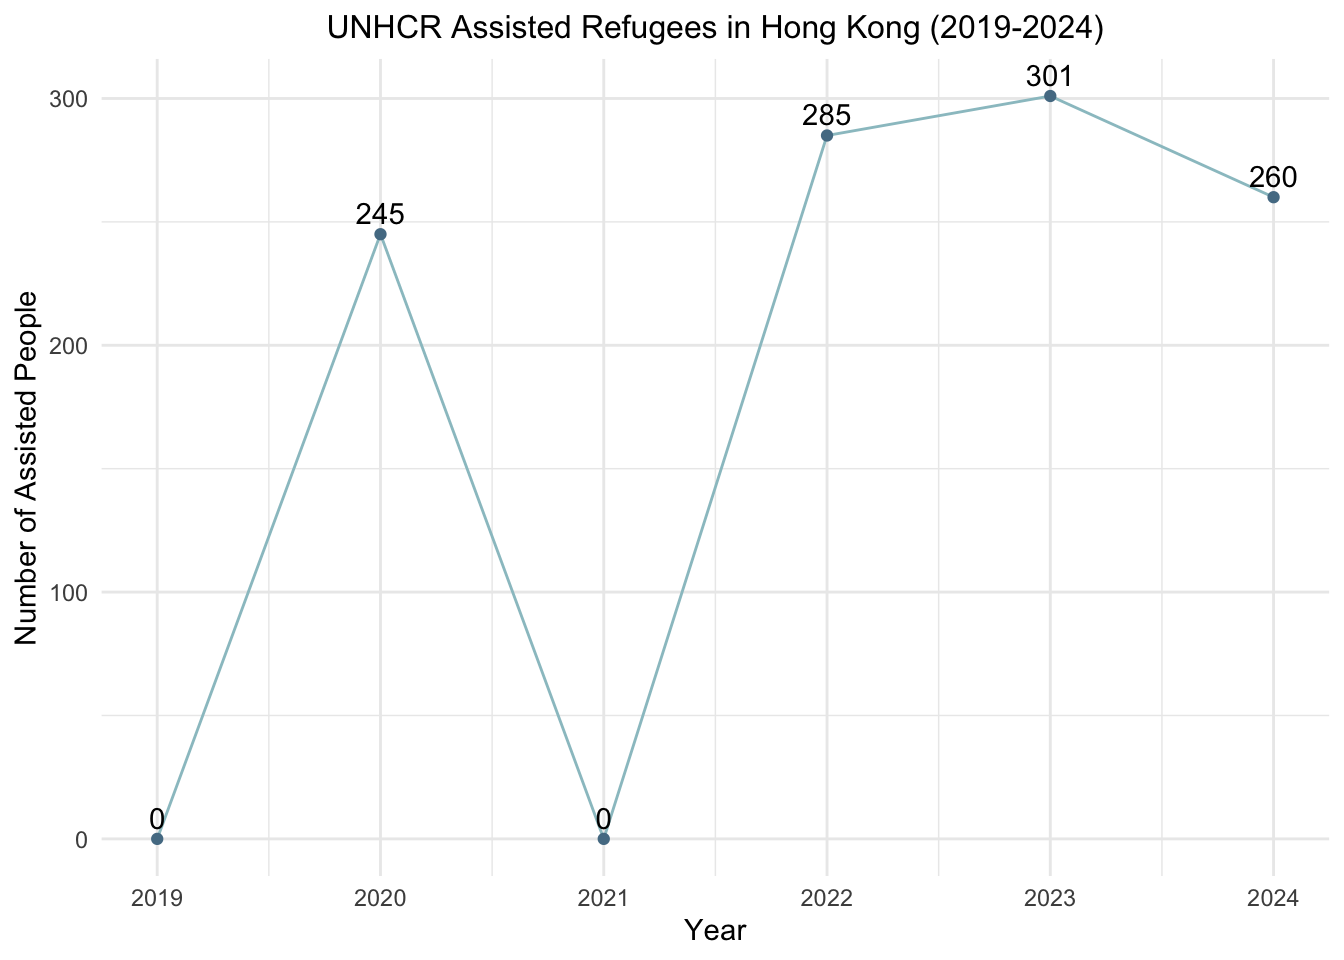
What changes have occurred in the number of “refugees and people in refugee-like situations” hosted in Hong Kong each year from 2019 to 2024 who received assistance from UNHCR?

# step 1: filter the refugee data in Hong Kong from 2019 to 2024 that was assisted by UNHCR
HK_host <- df_clean |>
  filter(ACountry == "China, Hong Kong SAR",
        (year >= 2019 & year <= 2024)) |>  # filter the year from 2019-2024 and the area of HK
  group_by(year) |>
  summarise(total_assisted = sum(total_assisted, na.rm = TRUE)) |> # total number of people assisted each year
  arrange(year) # sort in ascending order by year
print(HK_host)
# A tibble: 6 × 2
   year total_assisted
  <int>          <dbl>
1  2019              0
2  2020            245
3  2021              0
4  2022            285
5  2023            301
6  2024            260
# step 2: draw a line graph
ggplot(HK_host, aes(
  x = year,
  y = total_assisted))+
    geom_line(color = "#9BC3CA") + # draw a line chart
    geom_point(color = "#557c93") + # plot the data points
    geom_text(aes(label = total_assisted),
              vjust = -0.5,
              hjust = 0.5) + # set the position of the label
      labs(title = "UNHCR Assisted Refugees in Hong Kong (2019-2024)",
           x = "Year",
           y = "Number of Assisted People") +
  theme_minimal() +
  theme(plot.title = element_text(hjust = 0.5,
                                  size = 12)) # center the title and set the font size to 12

Q3:

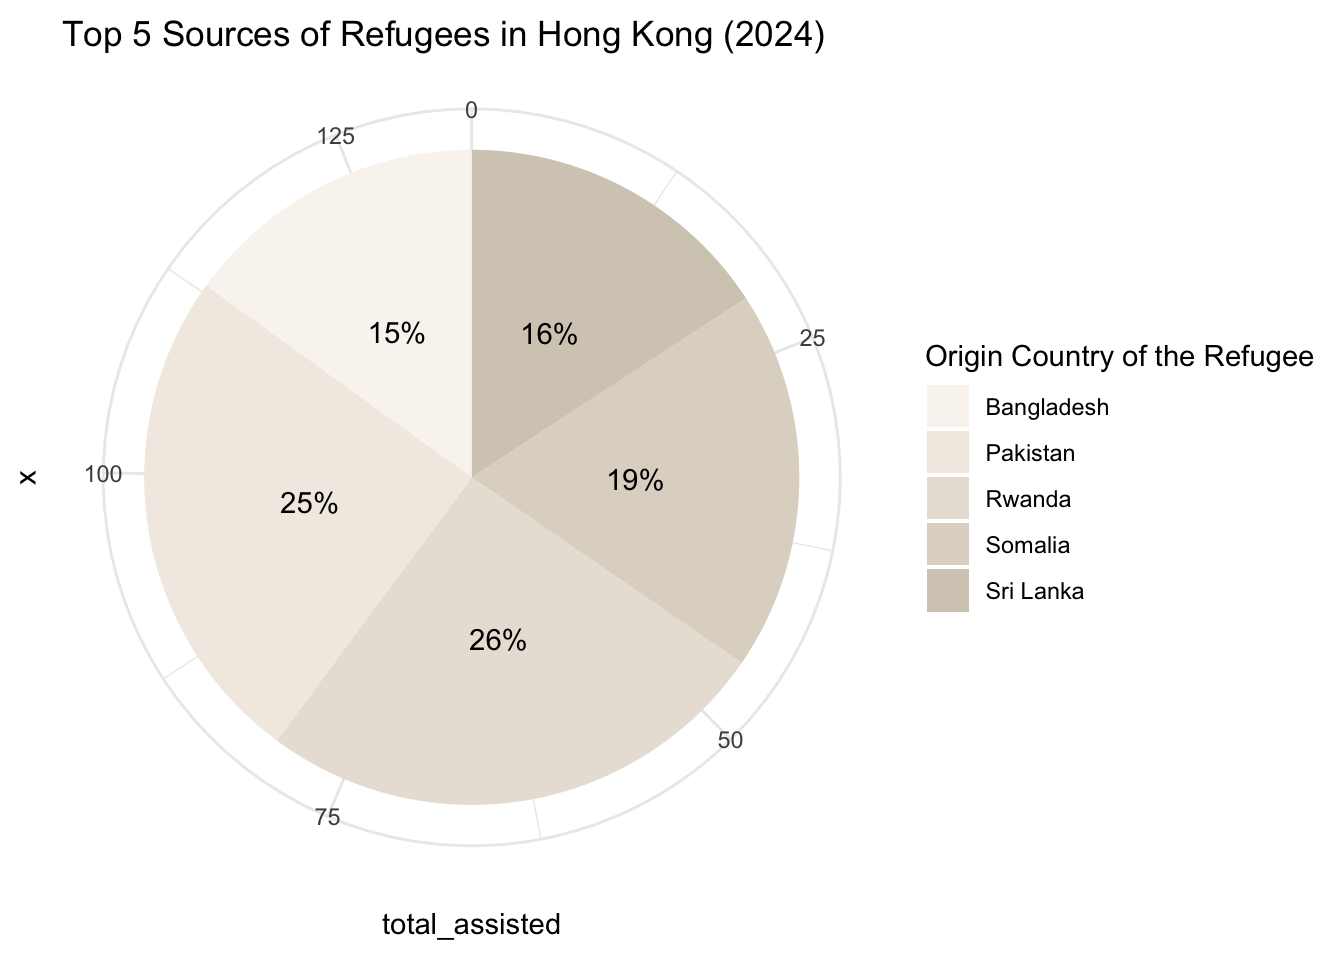
What are the Top 5 sources of “refugees and people in refugee-like situations” in Hong Kong in 2024?

# step 1: filter the refugee data of Hong Kong in 2024 and summarize it by source regions
HK_2024 <- df_clean |>
  filter(ACountry == "China, Hong Kong SAR",
         year == "2024") |>
  group_by(OCountry) |> # group by source country
  summarise(total_assisted = sum(total_assisted, na.rm = TRUE)) |>
  arrange(-total_assisted) |>
  head(n = 5) |> # only retain the first 5 rows
  mutate(percentage = paste0(round(total_assisted / sum(total_assisted) * 100), "%")) # calculate the percentage, and convert it into a string with a % sign.
print(HK_2024)
# A tibble: 5 × 3
  OCountry   total_assisted percentage
  <chr>               <dbl> <chr>     
1 Rwanda                 34 26%       
2 Pakistan               33 25%       
3 Somalia                25 19%       
4 Sri Lanka              21 16%       
5 Bangladesh             20 15%       
# step 2: # draw a pie chart
ggplot(HK_2024,aes(x="",
                   y = total_assisted,
                   fill = OCountry,
                   label = percentage)) +
  geom_bar(stat="identity") + # draw a  bar chart
  coord_polar("y") + # convert the bar chart to a pie chart
  geom_text(position = position_stack(vjust = 0.5)) + # centered the label in each sector
    labs(title = "Top 5 Sources of Refugees in Hong Kong (2024)",
         fill = "Origin Country of the Refugee") + 
     scale_fill_manual(values = c("#F9F5F0",
                                  "#F2ECE4",
                                  "#E9E2D8",
                                  "#DFD7CB",
                                  "#D4CCBE")) +
  theme_minimal()

Q4:

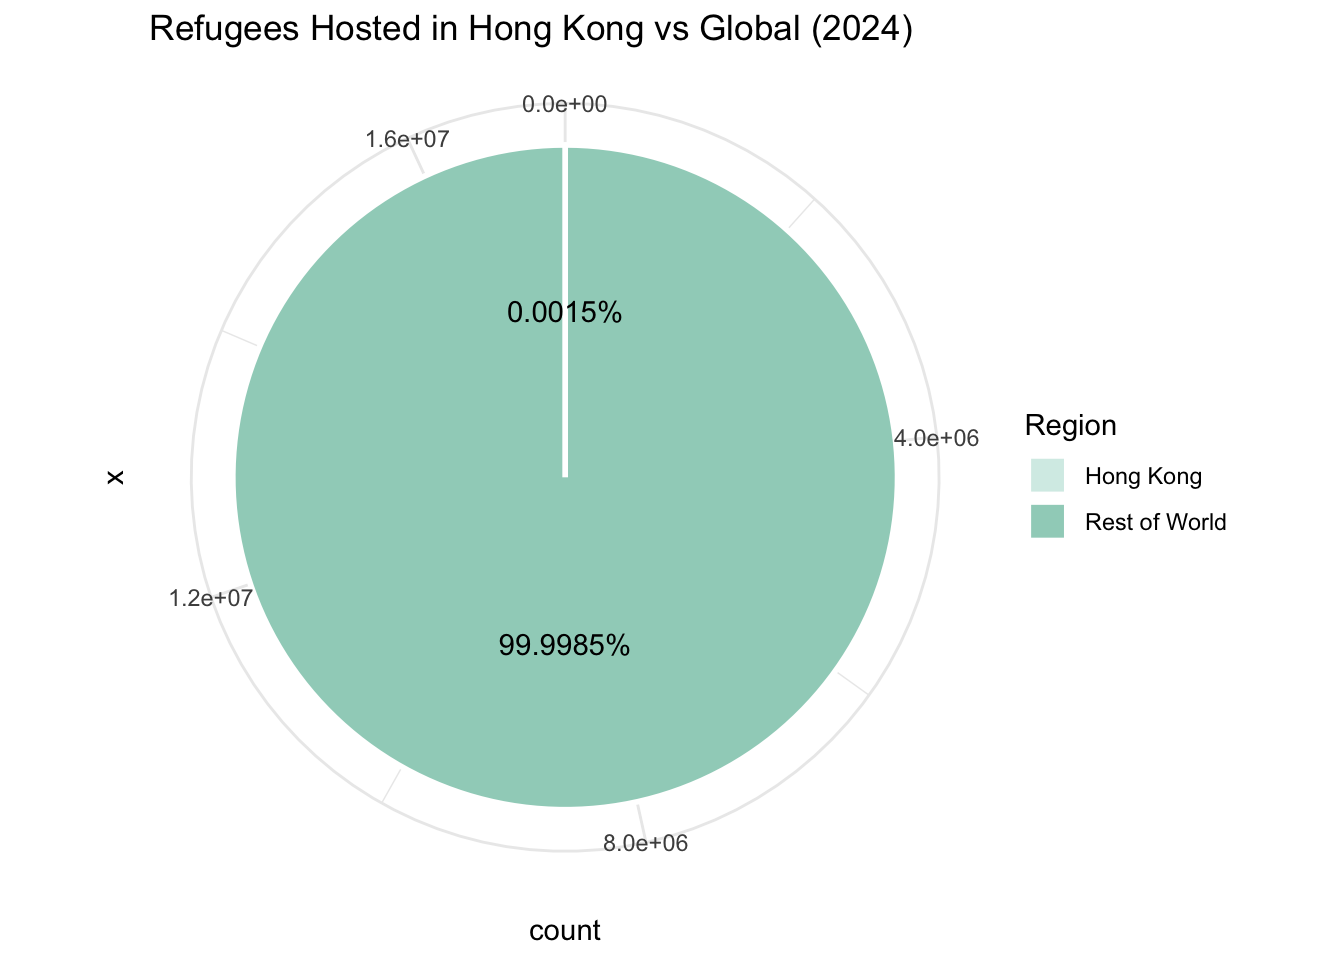
What percentage of the global total number of “refugees and people in refugee-like situations” does Hong Kong’s hosted refugee population account for in 2024?

# step 1: calculate the total number of global refugees in 2024
global_total <- df_clean |>
  filter(year == 2024) |>
  summarise(total = sum(total_assisted))
global_total <- global_total$total # extract values for convenient calculation
print(global_total)
[1] 17192475
# step 2: calculate the number of refugees in Hong Kong in 2024
hk_total <- df_clean |>
  filter(year == 2024, ACountry == "China, Hong Kong SAR") |>
  summarise(total = sum(total_assisted))
hk_total <- hk_total$total # extract values for convenient calculation
print(hk_total)
[1] 260
# step 3: generate pie chart data frame
pie_df <- data.frame(region = c("Hong Kong", "Rest of World"),
                     count = c(hk_total, global_total - hk_total)) |> # define two regional classifications for the pie chart and label corresponding number of people in each category
  mutate(percentage = paste0(round(count / sum(count) * 100, 4), "%")) # calculate the percentage of each part and keep four decimal places
# step 4: draw pie chart
ggplot(pie_df, aes(x = "",
                   y = count,
                   fill = region,
                   label = percentage)) + # only show the figures for Hong Kong and other regions
geom_bar(stat = "identity", # plot directly using the original values of the y-axis
         color = "white", 
         linewidth = 1) + # set the border width because the small sectors in Hong Kong will be covered
  coord_polar("y") + # convert the bar chart to a pie chart
  geom_text(position = position_stack(vjust = 0.5)) + # centered the label in each sector
  labs(title = "Refugees Hosted in Hong Kong vs Global (2024)",
       fill = "Region") +
    scale_fill_manual(values = c("Hong Kong" = "#D6EDE7",
                                 "Rest of World" = "#A0D2C3")) +
  theme_minimal()